
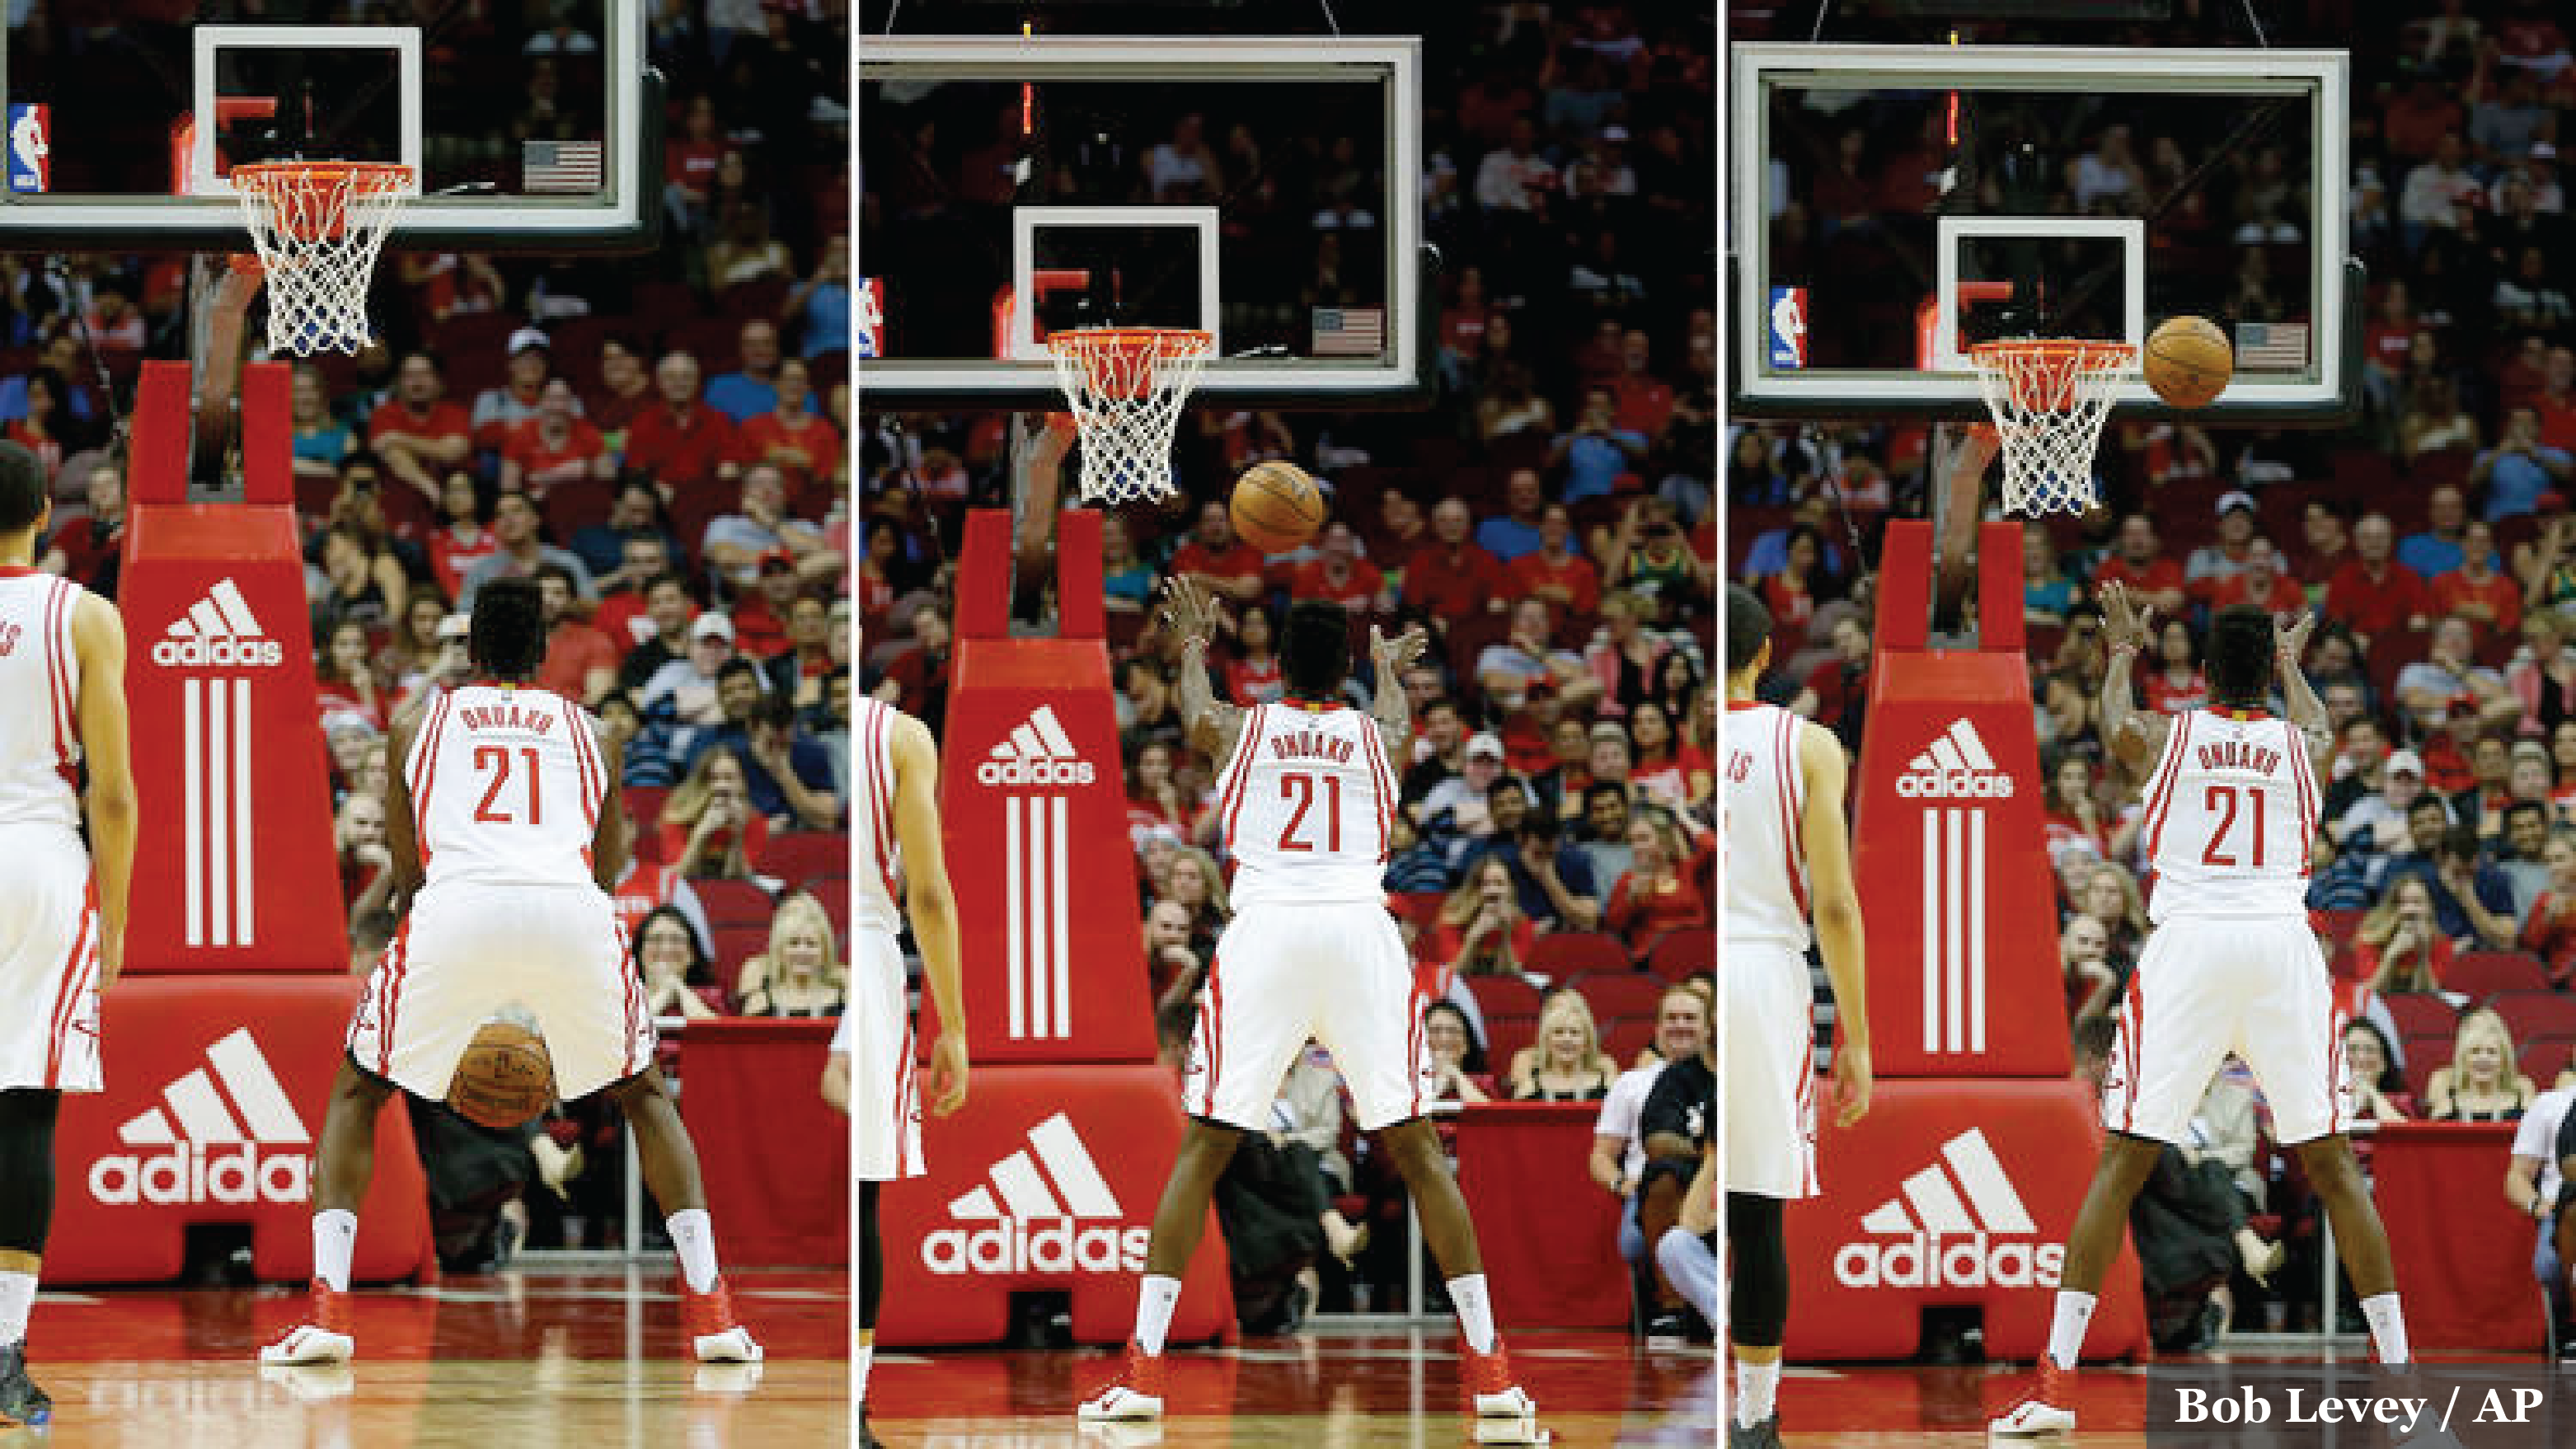
What makes a basketball go through a hoop? How hard and how high should you throw? While it can be difficult to know exactly how you are throwing a ball, the robot at this exhibit can be adjusted to perfect its technique! See if you can come up with a setting that allows the robot to make a basket every time.
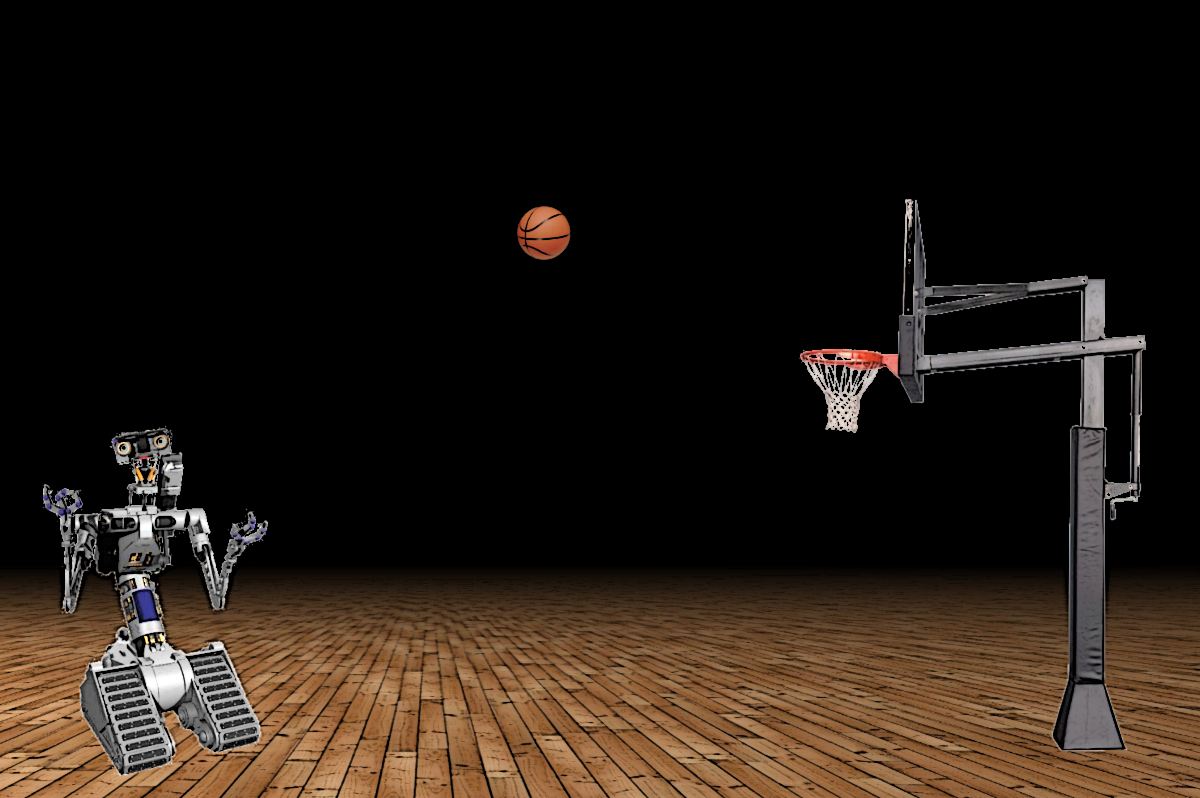
When modeling a physical problem, you should try to figure out what the variables might be — i.e., what are the things about the setup that you can change to effect a different outcome? Here are a few things that you can adjust:
How does changing these affect the outcome of your shot? A scientific way to investigate these is to hold all variables constant except one and study how changing that one variable affects the outcome. For example, if you hold height and speed constant, what happens as you change the angle? You might find that increasing the angle makes the ball go farther, but this only works up to a point. On the other hand, increasing the speed doesn’t have this sort of breaking point and always makes the ball go farther.
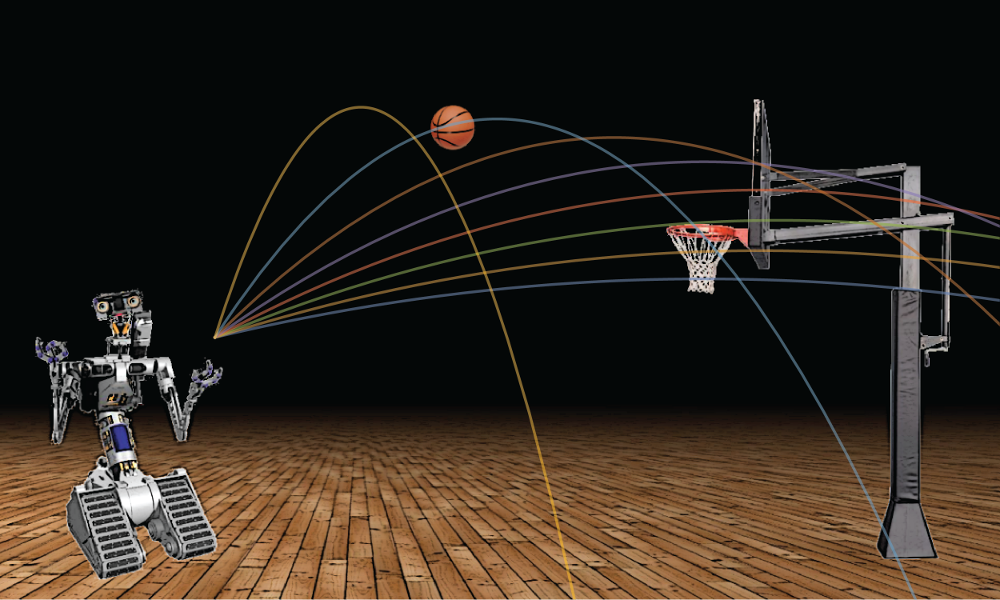
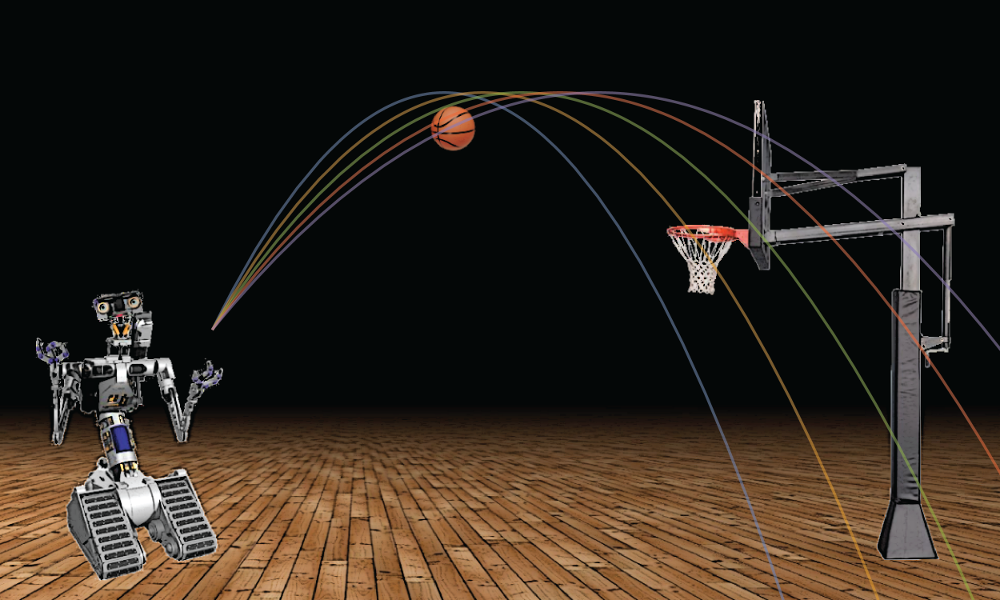
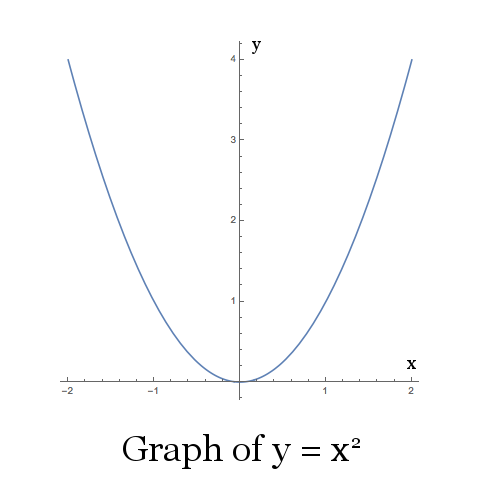
In the images, you might notice that some possible trajectories of the basketball have been highlighted in different colors. What are the shapes of these trajectories? It turns out that the paths that projectiles follow are roughly parabolic. If you have graphed functions, you might recognize as a parabola. It turns out that all parabolas are similar, so in some sense is the whole story — every other parabola is simply a scaling, translation, or rotation of that one!
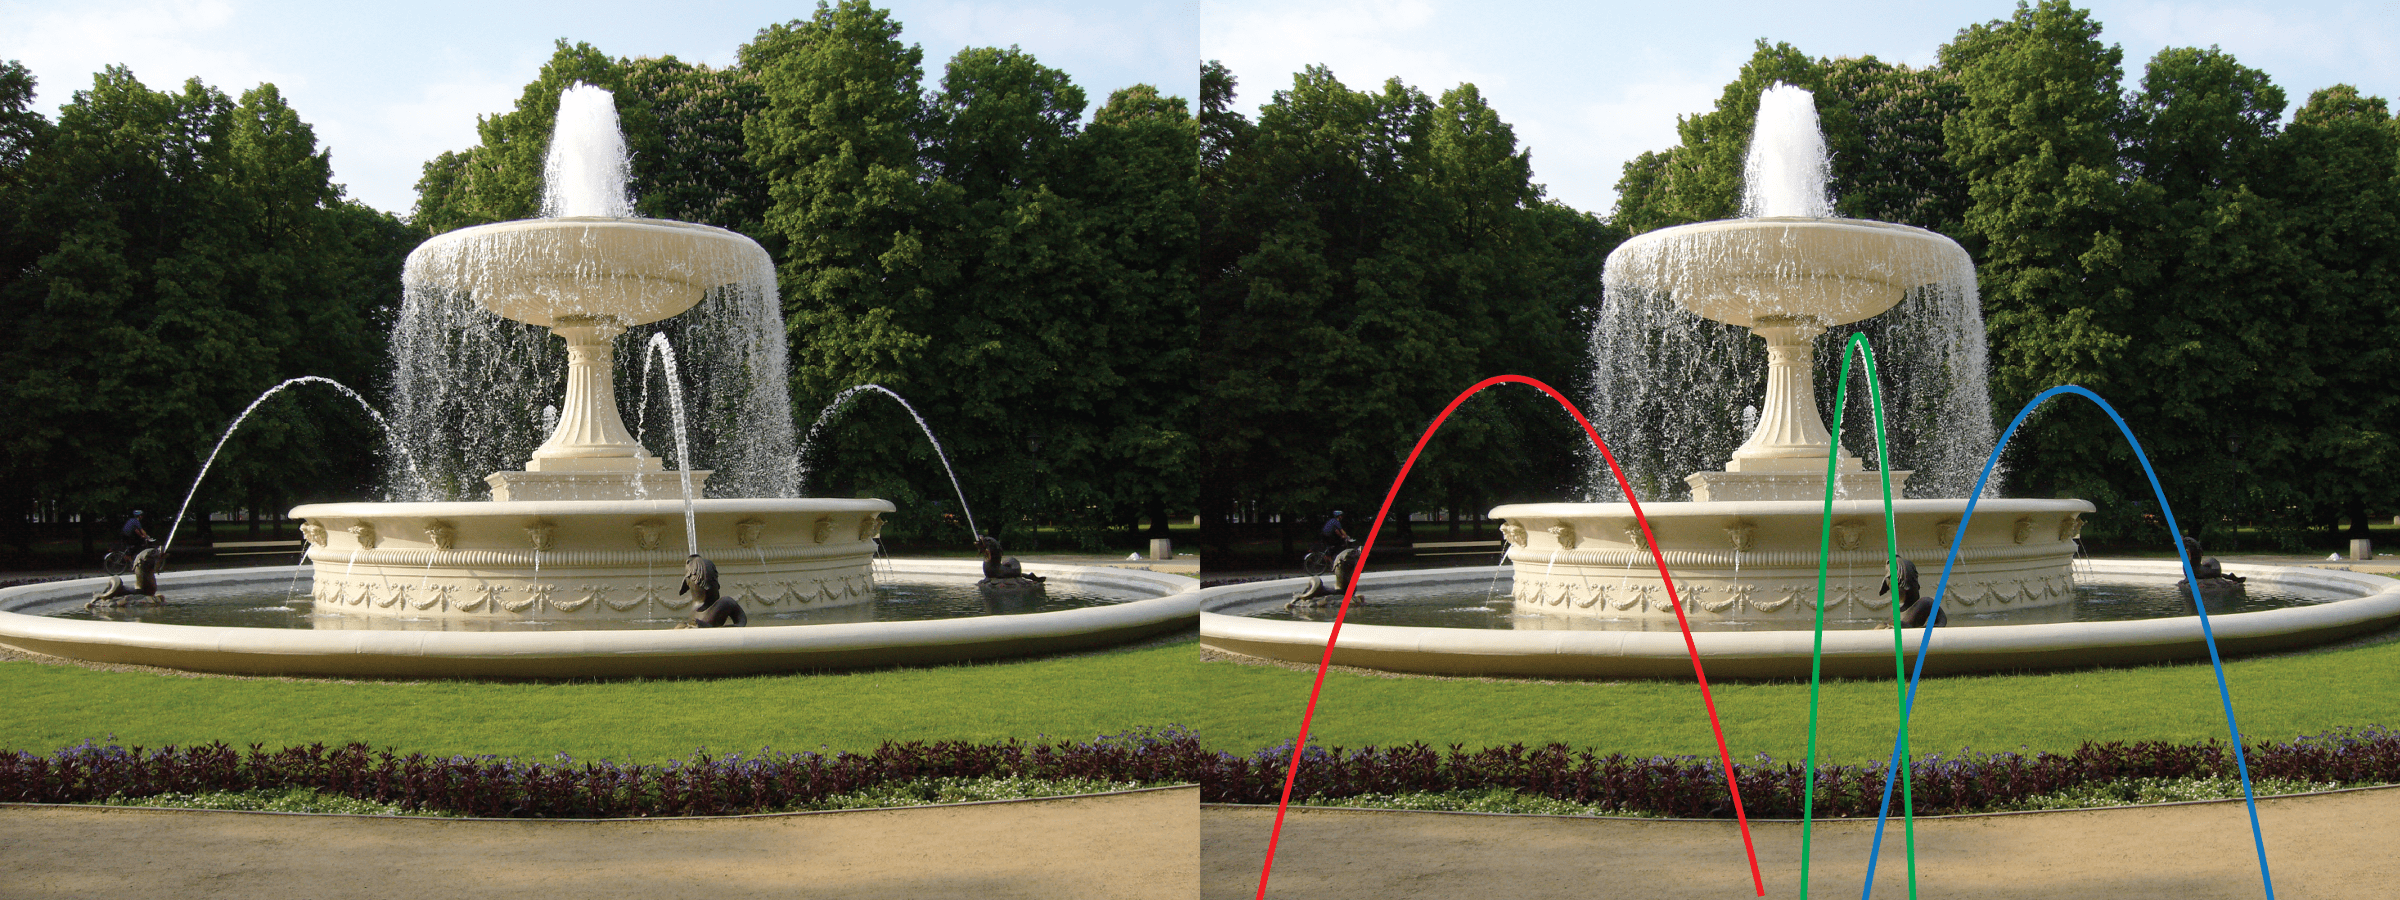
Perhaps even more amazingly, if you walk around a parabolic arch, it still appears to be a parabola from every other vantage point except when it lines up perfectly to give the appearance of a column. You can see this with the highlighted parabolas in the image of the fountain below — each of these is the same parabola but they appear to be scaled differently when viewed from different perspectives around the fountain.
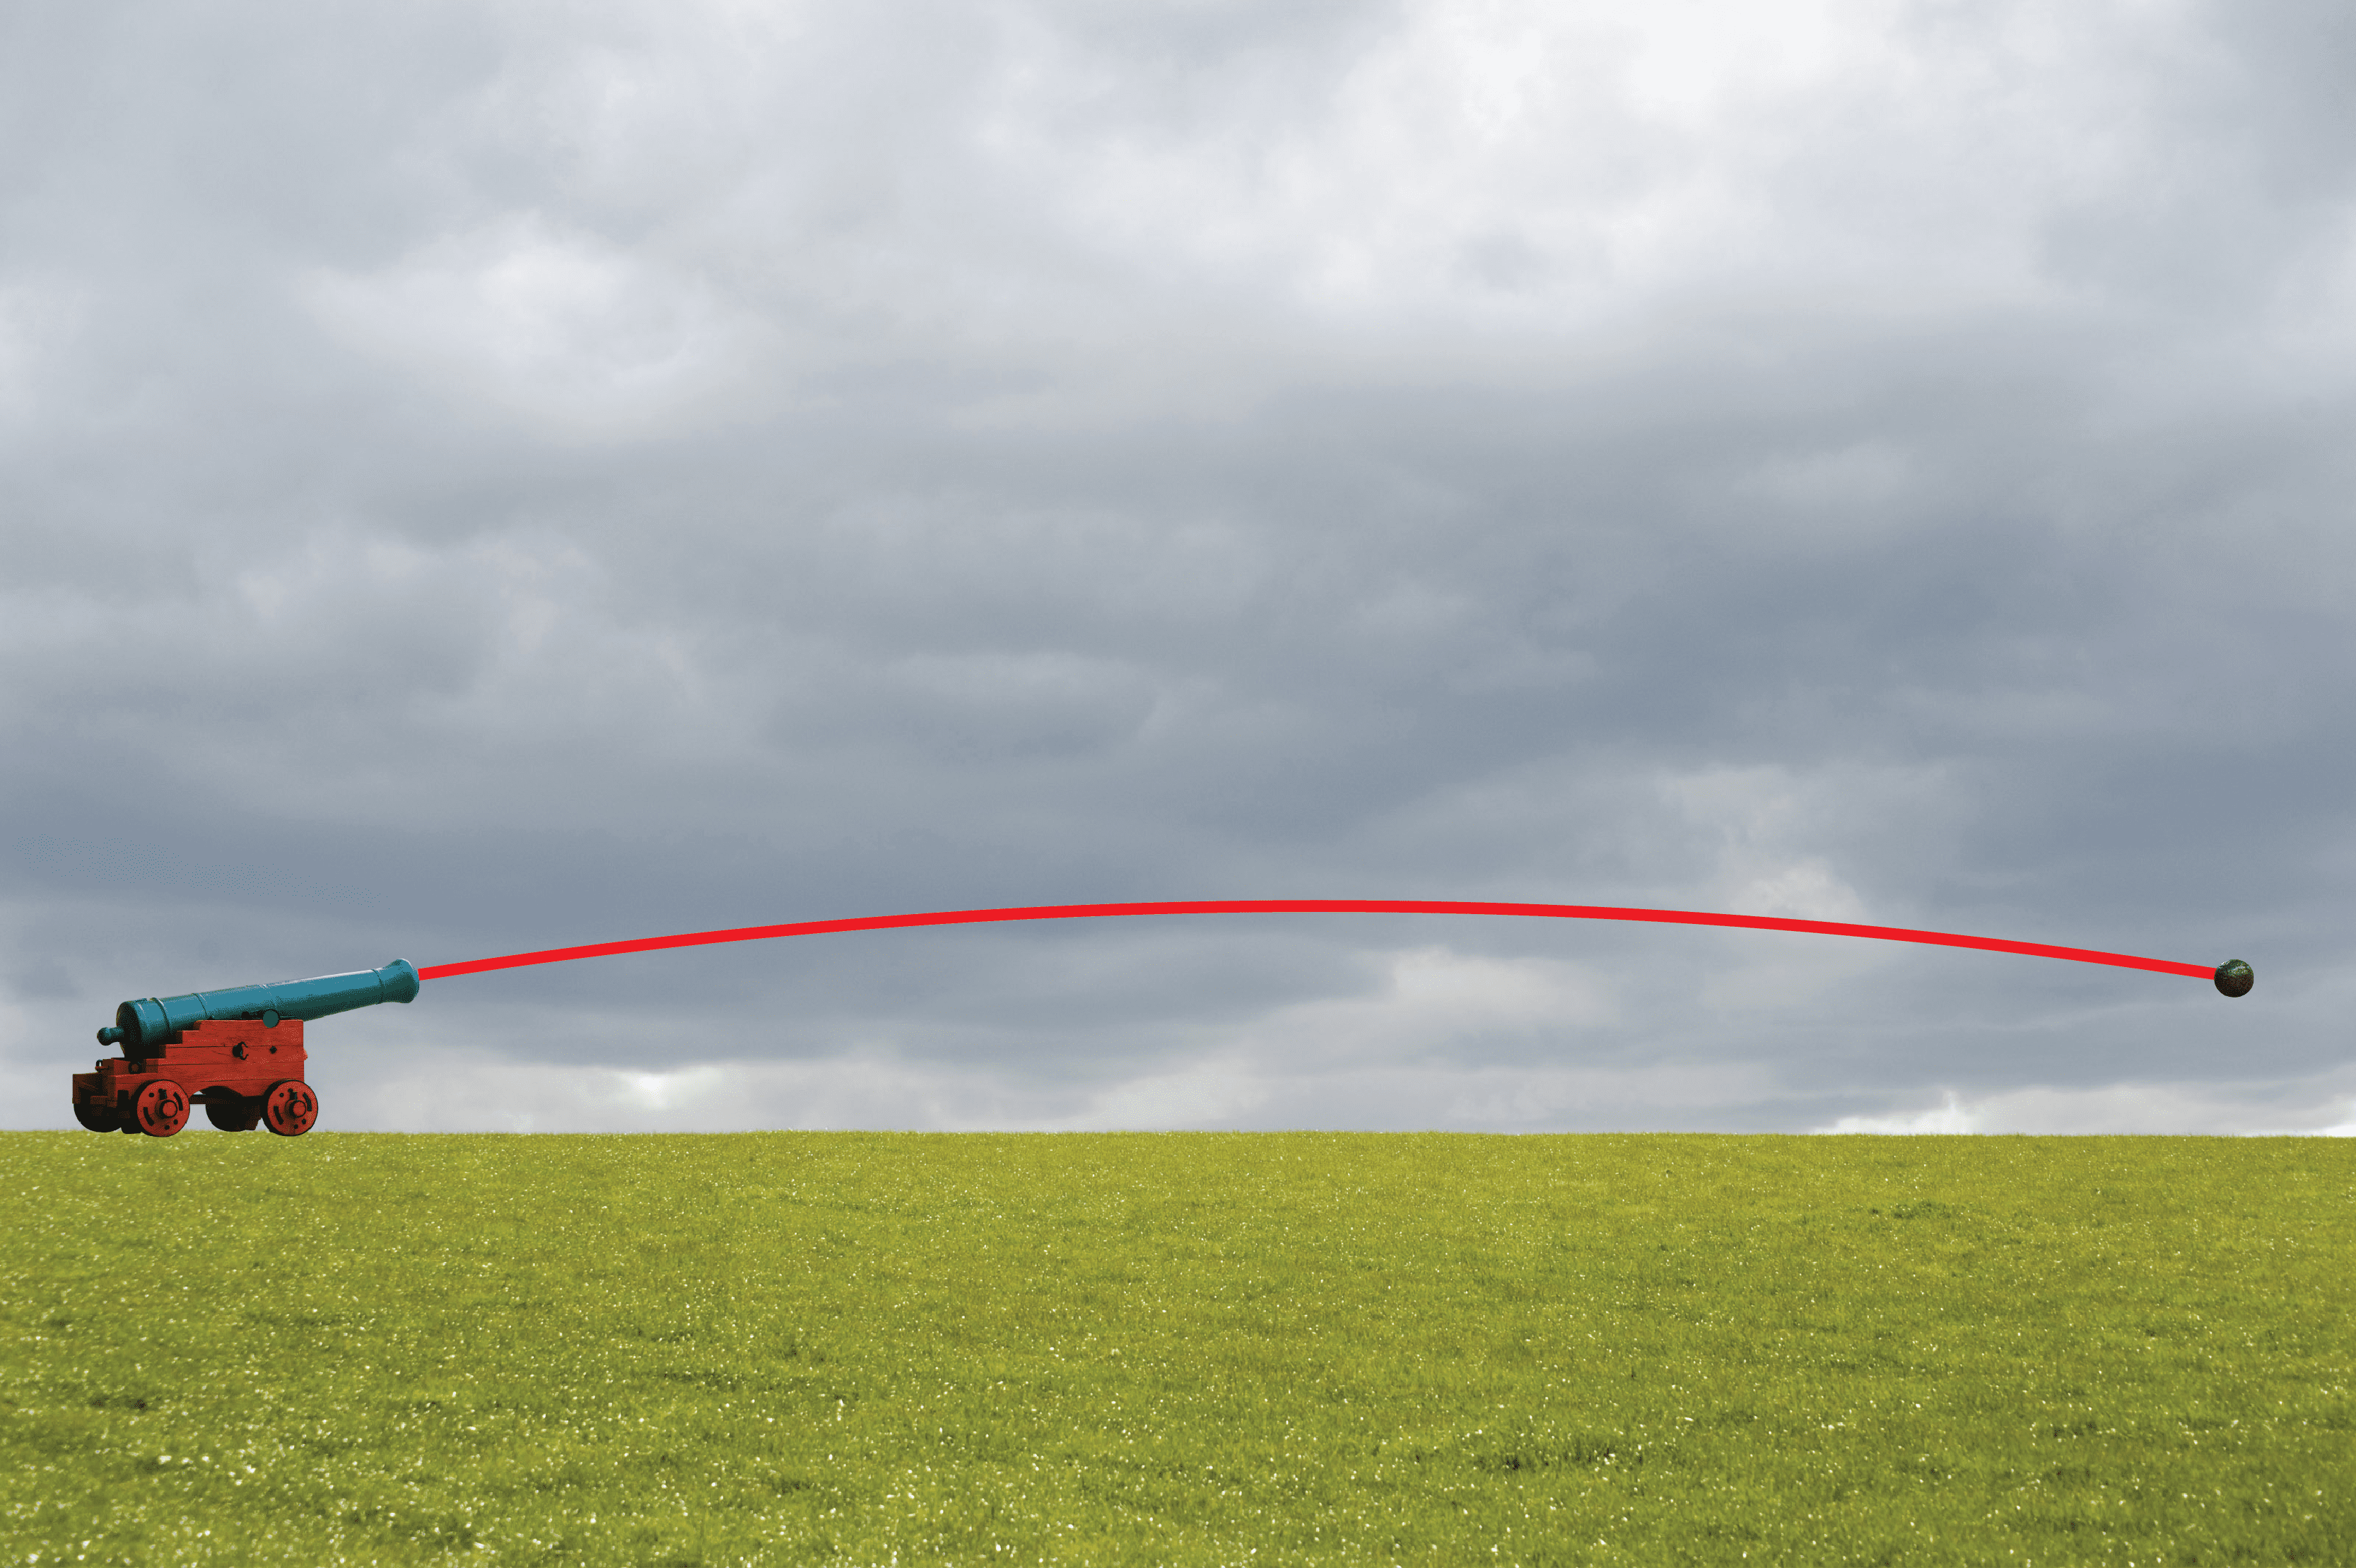
The study of projectile motion has been an important part of mathematical physics. Over short distances, we can think of the earth as being roughly flat. While gravity pulls radially towards the earth’s center, this approximation allows us to think of gravity as being a downward pull. Since gravity is only downwards, we end up with no horizontal acceleration but some amount of gravitational vertical acceleration (g, about 9.8 meters per second per second):
Calculus can then be used to turn these accelerations into velocities:
And then these velocities into positions:
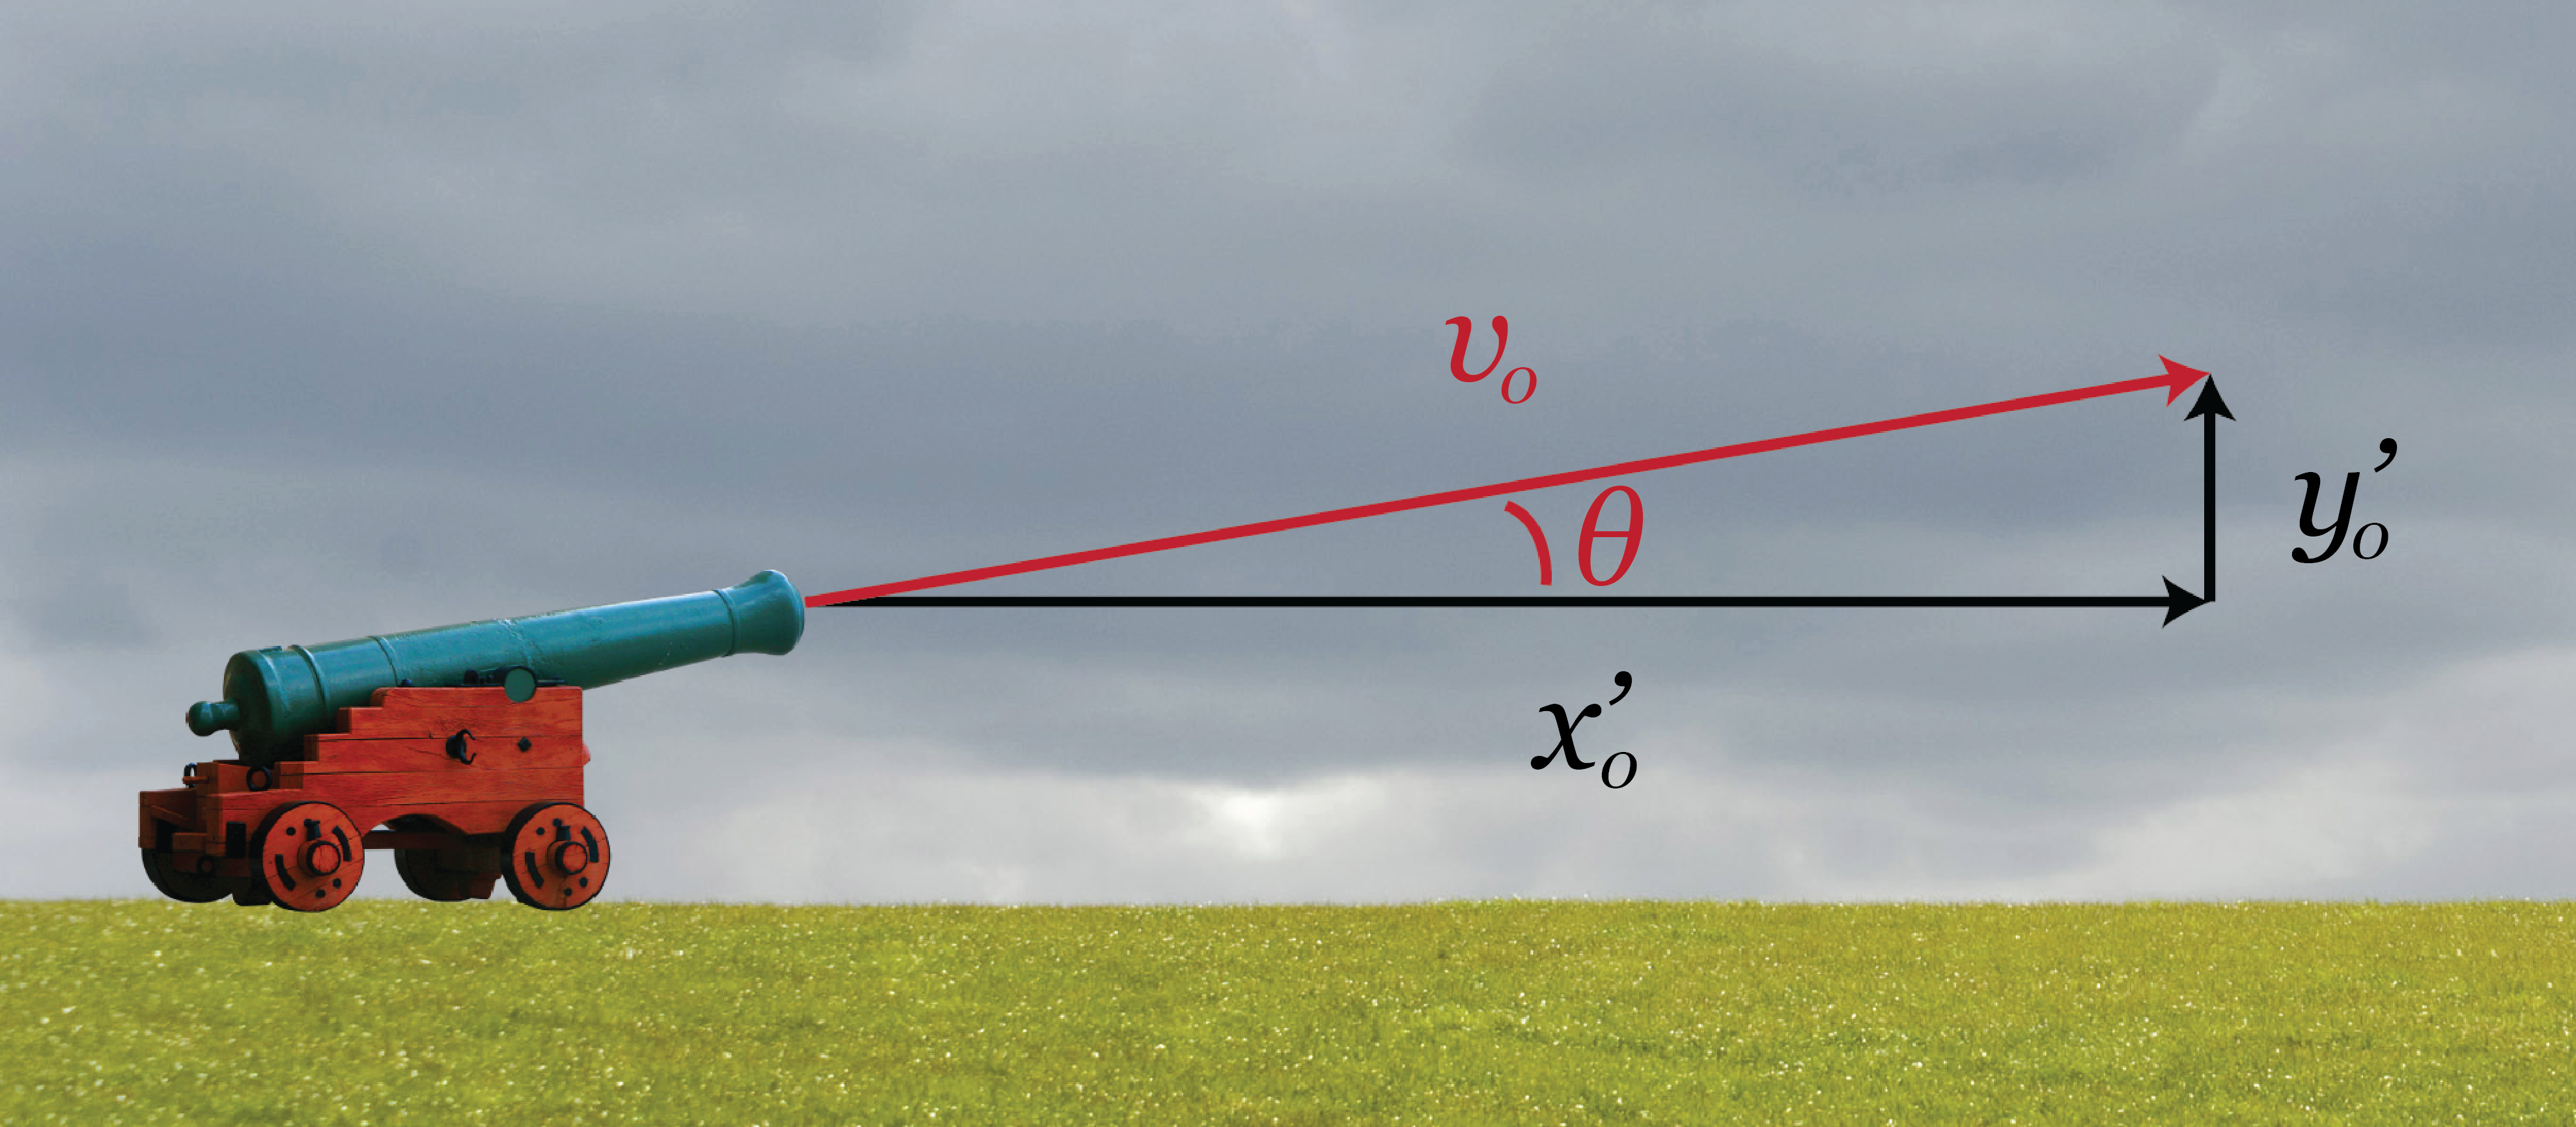
This mysterious calculus operation we alluded to earlier is called (indefinite) integration, and it made some strange constants pop up, which we called and . It turns out these are the variables we experiment with when we shoot hoops!
It might seem strange that we end up with these four and not one measuring overall speed or angle, but that information is actually encoded in these four quantities. If is the initial speed and the angle, then
Going the other direction,
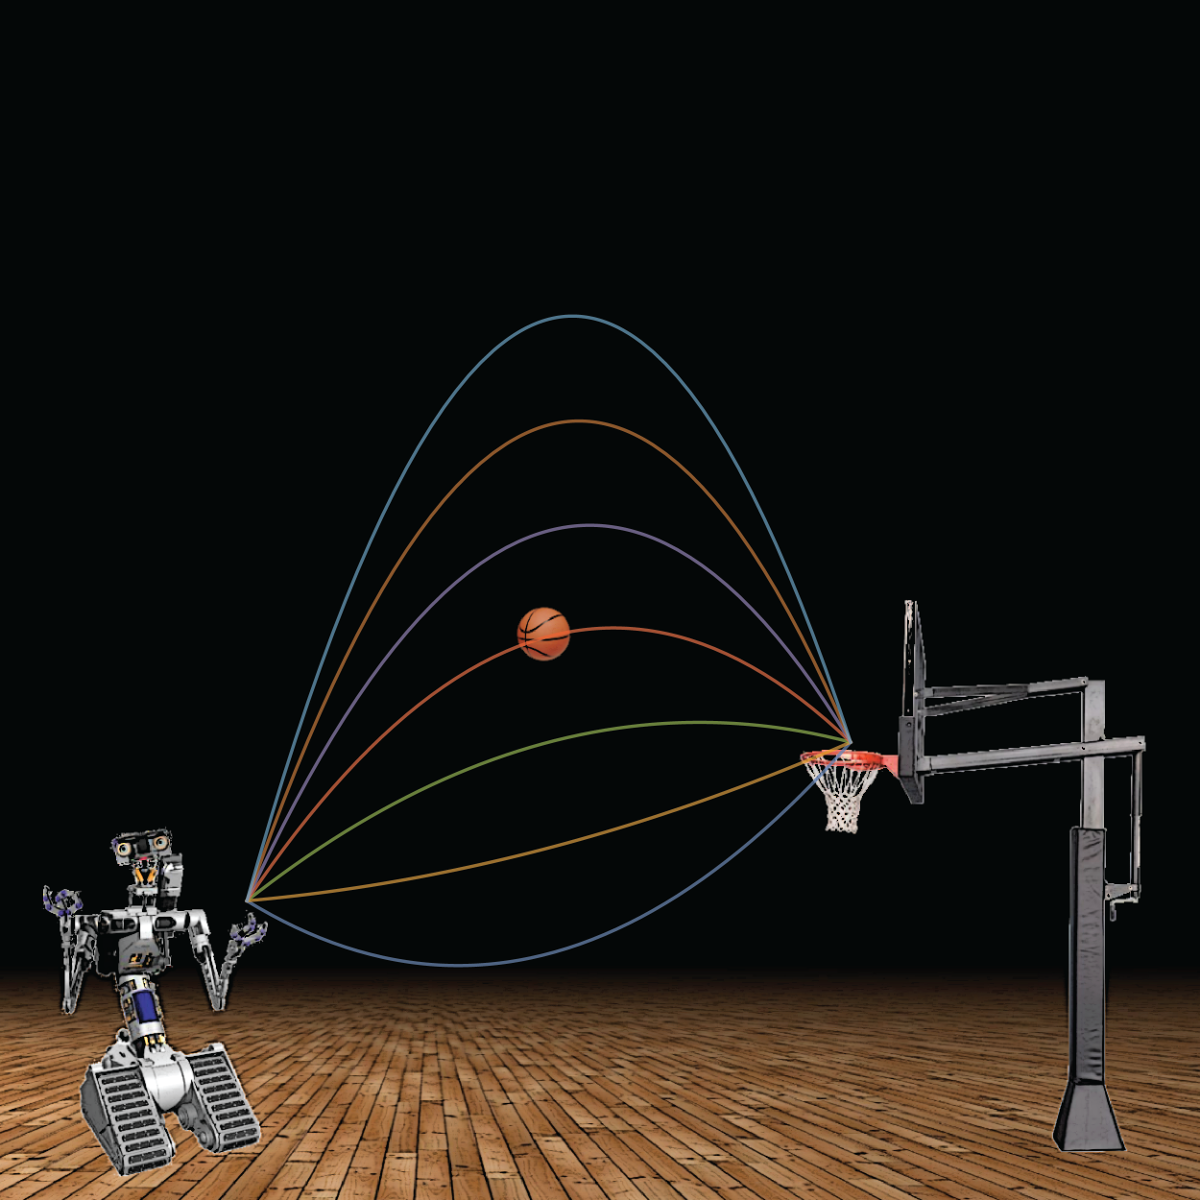
If we fix the initial position, then we still have the angle and speed to toggle. It turns out there’s not one right speed or angle to choose. We can actually find many ways to pair speeds and angles to make a basket. One way to think about this is purely in terms of geometry. If we have two points, there is exactly one line that runs between them. On the other hand, if we have two points (e.g., your hand and the center of the basketball hoop), there are many parabolas that run through both points. If we limit ourselves to parabolas that have vertical axes of symmetry as parabolas resulting from gravity do, then we’ll find a family of parabolas that hit both points, as shown in the picture. (One way to choose a parabola from this family is to specify how high the ball will be when it is halfway from your hand to the hoop, since three points will determine a vertically-oriented parabola.)
Note that some of these parabolas don’t correspond to real shots. It would be a strange world if you could release the ball downwards and then watch it float back up to the hoop, as in the bottom blue trajectory! The shallower arcs are more likely to hit the rim, which suggests why the underhand “granny shot” is such an effective way to make free throws — they tend to give a taller arc!
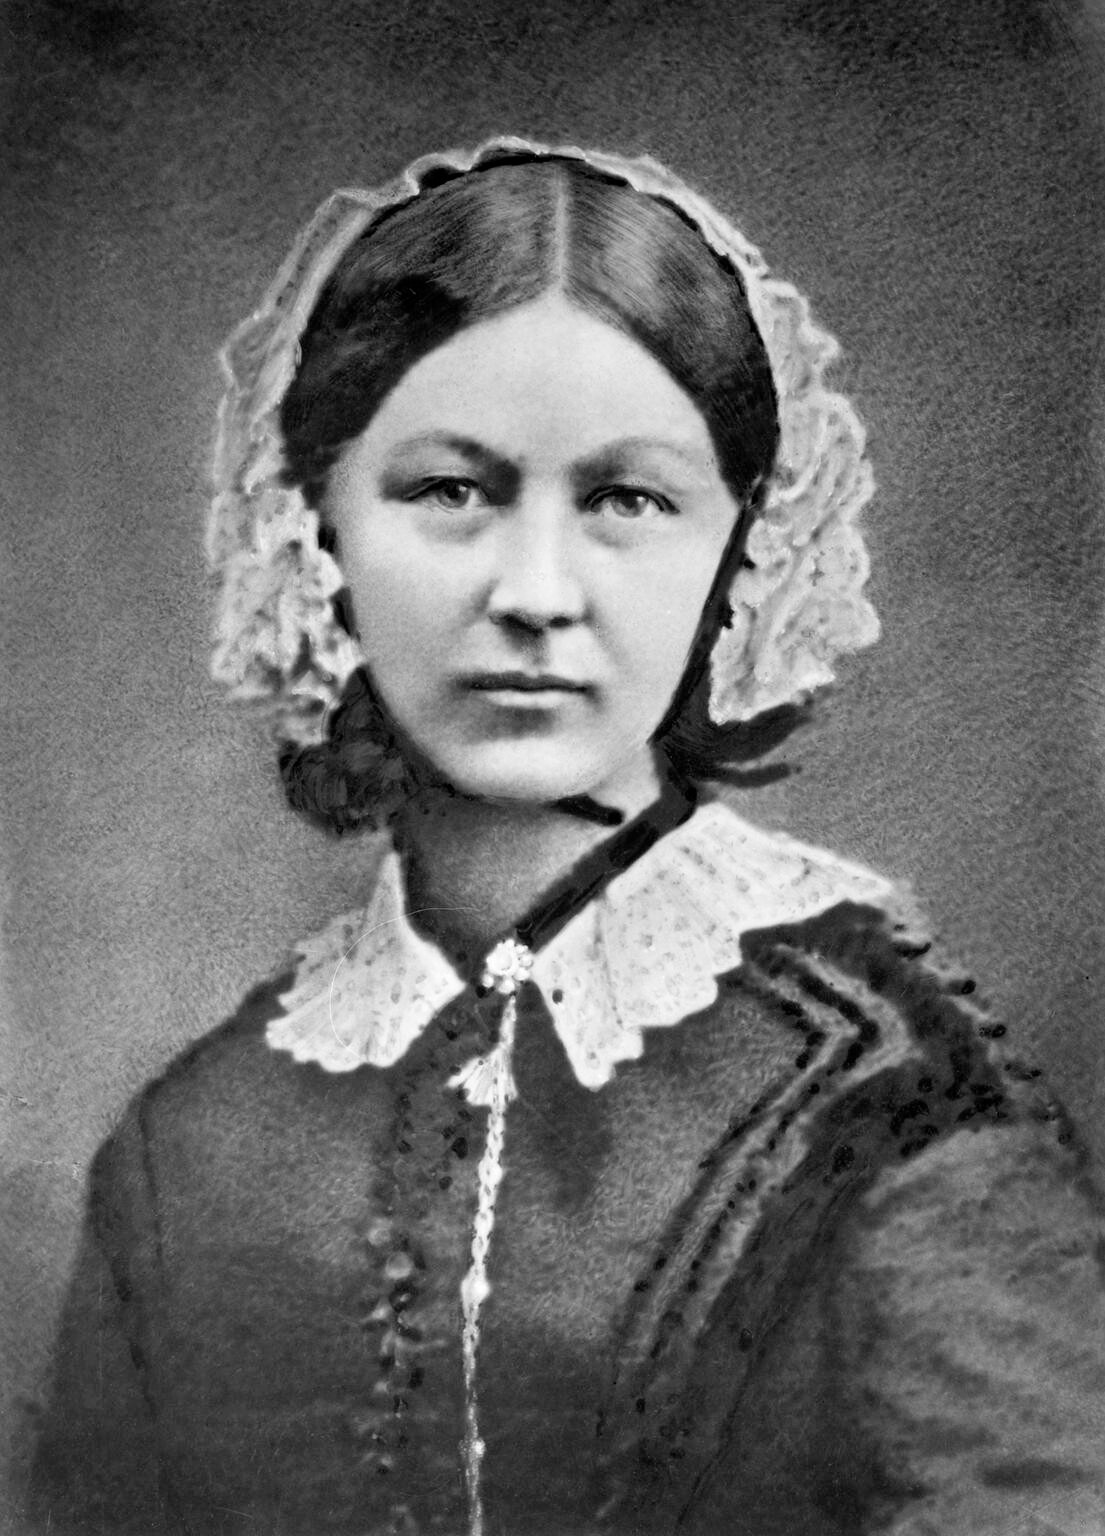
The parameters leading to a successful shot are analyzed statistically at this exhibit. But when did the visual presentation of information and statistical graphics get its start? British pioneer and founder of modern nursing, Florence Nightingale (1820 – 1910), introduced the use of statistical analysis to evaluate different medical treatments.